

The PISA P (PI) Chart[1] for Monitoring Project Implementation
ADVISORY ARTICLE
By Dr Kenneth Smith
Hawaii, USA
This article is a companion-piece to a previous Journal article on Earned Value,[2] and introduces a new graphic for monitoring & reporting integrated project schedule and cost performance status.
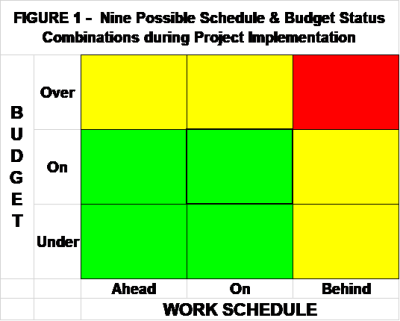
Every pedestrian Project Manager knows there are nine (9) different combinations in which a project can be during implementation with respect to its work schedule and budget, four of which are good, four mixed (good & bad) and one bad; as depicted in the following chart:
But Project Management Professionals (PMP)® of PMI[3] and other organizations familiar with the Earned Value Methodology (EVM) know better! Actually, thirteen (13) Schedule & Budget status combinations are possible. Unless recognized the additional four can result in invalid cost performance assessments, reports, inappropriate recommendations, and executive management decisions which in turn trigger detrimental ‘vicious cycle’ actions that exacerbate the current situation.
These four (4) additional combination conditions are often unrecognized because rather than monitoring the budget and actual cost for the work performed – i.e. whether completed ahead or behind schedule — traditional financial management focuses its attention on the time-phased budget for accomplishing work.
If the project stays ‘on schedule’ during implementation, Figure 1 accurately depicts the situation. However, in most other instances, the possibility of ‘False Positives’ or ‘False Negatives’ exists. For instance, if project work is completed ahead of schedule, even if ‘on budget’ it will entail utilizing its budget earlier than scheduled. Similarly, if project work is delayed, the likelihood is that the project should not yet have incurred the cost budgeted for its accomplishment. These possibilities are depicted in Figure 2, below.
More…
To read entire article, click here
How to cite this article: Smith, K. (2019). Adding Value to Earned Value: The PISA P (PI) Chart for Monitoring Project Implementation, PM World Journal, Vol. VIII, Issue XI, December. Available online at https://pmworldlibrary.net/wp-content/uploads/2019/12/pmwj88-Dec2019-Smith-adding-value-to-earned-value.pdf
About the Author

Dr. Kenneth Smith
Honolulu, Hawaii
![]()
Dr. Kenneth F. Smith has been a project management consultant for ADB, the World Bank, and USAID for decades. He earned his DPA (Doctor of Public Administration) from the George Mason University (GMU) in Virginia and his MS from Massachusetts Institute of Technology/MIT (Systems Analysis Fellow, Center for Advanced Engineering Study). A long-time member of the Project Management Institute (PMI) and IPMA-USA, Dr. Smith is a Certified Project Management Professional (PMP®) and a member of the PMI®-Honolulu Chapter.
Ken is the author of Project Management PRAXIS: A Treasure Trove of Practical Innovations to Classic Tools and Techniques for Planning, Monitoring & Evaluating Projects, Programs and Portfolios for “Quick and Easy” application by Project Management Practitioners. (Available from Amazon)
Dr. Smith can be contacted at kenfsmith@aol.com
[1] PISA PI: Project Implementation Status Altimeter Performance Indicator Chart
[2] Smith, K. F. (2019). Understanding & Applying Earned Value: A ‘Quick & Easy’ Approach for Monitoring Project Implementation, PM World Journal, Vol. VIII, Issue V, June.
[3] The international Project Management Institute (PMI)®