

FEATURED PAPER
By Pat Weaver
Melbourne, Australia
Introduction
The purpose of this paper is to consolidate the available information on the creation and evolution of the work breakdown structure (WBS). The introduction incudes a brief précis of a number of previous history papers developed by the author that set the starting point for the creation of various business charts[1]. The next section looks at three chart types for the early 20th century that appear to lay the foundations needed for the creation of the WBS. The final section looks at the initial documentation of the WBS. Where available, some of the more important original documents have been sourced and are now directly linked on the Mosaic website to retain direct access to the source over time. This is a work in progress, in particular there seems to be very little information on developments between the 1920s and 1950s and very little documentation from sources outside of the USA. Any help readers can provide in these areas will be appreciated.
Origins of business graphics
The use of charts to help understand business data and structures appears to have originated with the work of William Playfair (1759-1823). He is credited with developing a range of statistical charts including the line, bar (histogram), and pie chart[2].
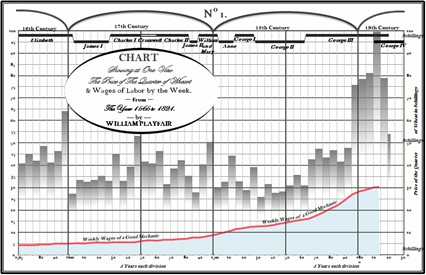
The data presentations invented by Playfair were primarily graphs and histograms designed to show and compare time-series data[3].
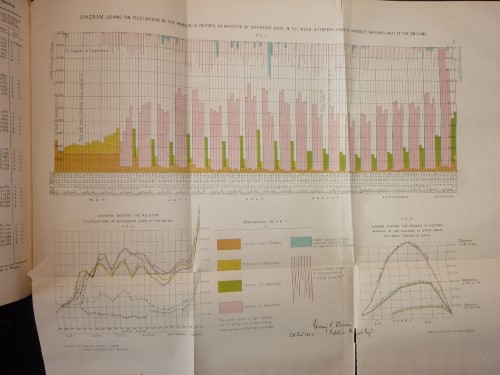
Charts similar to Playfair’s are contained in the reports of the Royal Commissioners responsible for constructing the exhibition buildings and facilities, and staging the Great Exhibition in London in 1851[4]:
Playfair used the same graphical concepts that Joseph Priestley (England, 1733-1804) used in his 1765 ‘Chart of Biography’, a bar chart[5] that plots some 2000 famous lifetimes against a time scale, in which “…a longer or a shorter space of time may be most commodiously and advantageously represented by a longer or a shorter line.”. This parallel development evolved into the project management bar charts of today.
More…
To read entire paper, click here
How to cite this paper: Weaver, P. (2021). The Origins of WBS & Management Charts; PM World Journal, Vol. X, Issue XII, December. Available online at https://pmworldlibrary.net/wp-content/uploads/2021/12/pmwj112-Dec2021-Weaver-origins-of-wbs-and-management-charts-featured-paper.pdf
About the Author

Patrick Weaver
Melbourne, Australia
![]()
Patrick Weaver, PMP, PMI-SP, FAICD, FCIOB, is the Managing Director of Mosaic Project Services Pty Ltd, an Australian project management consultancy specialising in project control systems. He is a Fellow of the Chartered Institute of Building, Australasia (FCIOB) and a Fellow of the Australian Institute of Company Directors (FAICD). He is a member of the the PMI Melbourne Chapter (Australia), as well a full member of AIPM, and the Project Management College of Scheduling (PMCOS).
Patrick has over 50 years’ experience in Project Management. His career was initially focused on the planning and managing of construction, engineering and infrastructure projects in the UK and Australia. The last 35 years has seen his businesses and experience expand to include the successful delivery of project scheduling services and PMOs in a range of government, ICT and business environments; with a strong focus on project management training.
His consultancy work encompasses: developing and advising on project schedules, developing and presenting PM training courses, managing the development of internal project control systems for client organisations, and assisting with dispute resolution and claims management.
In the last few years, Patrick has sought to ‘give back’ to the industry he has participated in since leaving college through contributions to the development of the project management profession. In addition to his committee roles he has presented papers at a wide range of project management conferences in the USA, Europe, Asia and Australia, has an on-going role with the PGCS conference in Australia and is part of the Australian delegation to ISO TC258.
Patrick can be contacted at patw@mosaicprojects.com.au or at www.mosaicprojects.com.au.
[1] To access the full collection of project management history papers developed and maintained by Mosaic Project Services, see: https://mosaicprojects.com.au/PMKI-ZSY.php
[2] Playfair originally published The Commercial and Political Atlas in London, in 1786. The chart above is from the 1821 edition of his Atlas. (source: Tufte, 1983, p. 34)
[3] For more on the development of this type of chart see The Origins of Schedule Management: the concepts used in planning, allocating, visualizing and managing time in a project: https://mosaicprojects.com.au/PDF_Papers/P202_The_Origins_of_Schedule_Management.pdf
[4] For more on the ‘Great Exhibition’, and the building of the ‘Crystal Palace’ see Project Governance & Control, The Building of the Crystal Palace. Note: the very fragile nature of the report prevented a better image being captured:
https://mosaicprojects.com.au/PDF_Papers/P180-Project_Governance-Building_the_Crystal_Palace.pdf
[5] A redacted version of Priestley’s Chart of Biography (1765), obtained from: https://upload.wikimedia.org/wikipedia/commons/9/98/PriestleyChart.gif